Annotation
In progress
BLAST results
What is the meaning of the minLrap and maxLrap values?
These values are ratios of alignment lengths computed for each comparison using the BLAST software :
minLrap = Lmatch/min(Lprot1, Lprot2)
maxLrap = Lmatch/max(Lprot1, Lprot2)
where Lmatch = length of the match, Lprot1 = length of protein 1, Lprot2 = length of protein 2.
if minLrap=1 and maxLrap=1 => the 2 proteins both align on their whole length
if minLrap=1 ans maxLrap<1 => one of the proteins is longer than the other, or the alignment is partial. Different interpretations are possible:
the longer protein is a modular protein (domain fusion/fission)
there is an erroneous start codon for one of the 2 genes
the smaller gene is a fragment (pseudogene).
a frameshift (due to a sequencing error or not) causes a premature stop codon in one of the genes.
if minLrap<1 and maxLrap<1 => the sequences are poorly aligned. We can observe this kind of situation in the case of gene remnants.
What is the meaning of orderQ and orderB values?
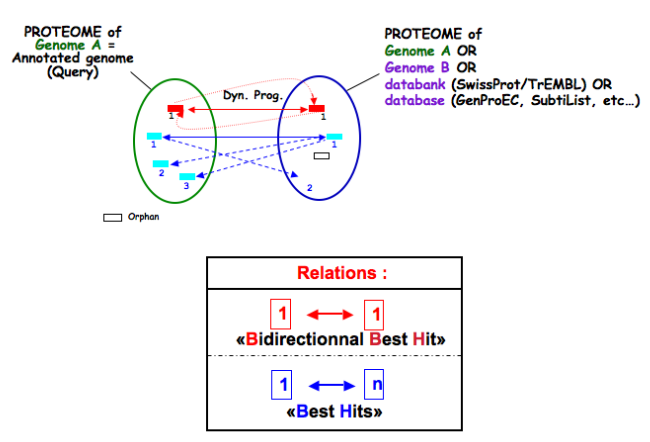
The orderQ and orderB values give an information about the rank of the BLAST hit for a protein of the query genome (orderQ) or for a protein of a databank (orderB).
Best bidirectional Best Hits (BBH) will have a 1:1 relationship The following Best hits will have 1<=>n relationship
Tip
These indicators can be useful to identify fusion/fission events.
Tools
Which program is used to detect the repeats ?
Repeat detection is performed by the Repsek program.
More: http://wwwabi.snv.jussieu.fr/ public/RepSeek/
What is the “BioProcess” classification?
This functional classification is based on the CMR JCVI Role IDs.
This field is optionally filled in during the expert annotation process.
What is the “Roles” classification?
This functional classification corresponds to the MultiFun classification which has been developed by Monica Riley for E. coli (http://genprotec.mbl.edu/).
This field is optionally filled in during the expert annotation process.
What is HAMAP?
HAMAP (High-quality Automated and Manual Annotation of microbial Proteomes) is a system, based on manual protein annotation, that identifies and semi-automatically annotates proteins that are part of well-conserved families or subfamilies: the HAMAP families. HAMAP is based on manually created family rules and is applied to bacterial, archaeal and plastid-encoded proteins.
More: http://www.expasy.ch/sprot/hamap/
Reference:
What is UniProt?
The Universal Protein Resource (UniProt) is a comprehensive resource for protein sequence and annotation data. The mission of UniProt is to provide the scientific community with a comprehensive, high-quality and freely accessible ressource of protein sequence and functional information.
The UniProt Knowledgebase consists of two sections:
Swiss-Prot which contains high quality manually annotated and non-redundant protein sequences. This database brings together experimental results, computed features and scientific conclusions.
TrEMBL which contains protein sequences associated with computationally generated annotation and large-scale functional characterization that await full manual annotation.
More than 99% of the protein sequences provided by UniProtKB are derived from the translation of the coding sequences (CDS) which have been submitted to the public nucleic acid databases, the EMBL-Bank/GenBank/DDBJ databases. All these sequences, as well as the related data submitted by the authors, are automatically integrated into UniProtKB/TrEMBL.
More: http://www.uniprot.org/
What are MetaCyc Pathways?
MetaCyc pathways are metabolic networks as defined in the MetaCyc Database.
The presence or absence of a MetaCyc metabolic pathway is predicted by the Pathway-tools algorithm in this organism.
P. Karp, S. Paley, and P. Romero “The Pathway Tools Software,” Bioinformatics 18:S225-32 2002
What is FigFam?
“FIGfams, a new collection of over 100 000 protein families that are the product of manual curation and close strain comparison. Using the Subsystem approach the manual curation is carried out, ensuring a previously unattained degree of throughput and consistency. FIGfams are based on over 950 000 manually annotated proteins and across many hundred Bacteria and Archaea. Associated with each FIGfam is a two-tiered, rapid, accurate decision procedure to determine family membership for new proteins. FIGfams are freely available under an open source license.” (quote from http://www.ncbi.nlm.nih.gov/pmc/articles/PMC2777423/ )
What is PsortB?
PsortB is an open-source tool for protein sub-cellular localization prediction in bacteria.
More: http://www.psort.org/
What is InterPro?
InterPro is an integrated database of predictive protein “signatures” used for the classification and automatic annotation of proteins and genomes. InterPro classifies sequences at superfamily, family and subfamily levels, predicting the occurrence of functional domains, repeats and important sites. InterPro adds in-depth annotation, including GO terms, to the protein signatures.
What is SignalP ?
SignalP (version 4.1) predicts the presence and location of signal peptide cleavage sites in amino acid sequences from different organisms: Gram-positive prokaryotes, Gram-negative prokaryotes, and eukaryotes. The method incorporates a prediction of cleavage sites and a signal peptide/non-signal peptide prediction based on a combination of several artificial neural networks and hidden Markov models.
Reference:
What is TMHMM?
TMHMM (version 2.0c) is a program for the prediction of transmembrane helices based on a hidden Markov model. The program reads a fasta-formatted protein sequence and predicts locations of transmembrane, intracellular and extracellular regions.
More: http://www.cbs.dtu.dk/services/TMHMM/
References:
What is antiSMASH?
antiSMASH allows the rapid genome-wide identification, annotation and analysis of secondary metabolite biosynthesis gene clusters in bacterial and fungal genomes. It integrates and cross-links with a large number of in silico secondary metabolite analysis tools that have been published earlier.
More: http://antismash.secondarymetabolites.org/#!/about
References:
What is Artemis?
Artemis is a free genome viewer and annotation tool that allows visualisation of sequence features and the results of sequence analyses. It also supports all six-frame translations. It has been developed at the Sanger Institute.
Tip
Artemis is based on the Java Web Start technology. See how to use Java Web Start.
What is CGView?
CGView (see https://js.cgview.ca/) is a Circular Genome Viewing tool for visualizing and interacting with small genomes. This tool is integrated on several pages of MicroScope.
The viewer displays several rings called tracks (see below). Each track displays one or several types of objects. An object (or feature) can be represented:
as an arrow for features localized on a specific strand; in this case, the track is composed of 2 rings: the outermost one displays the negative strand and the innermost one the positive strand (usually with the same color code)
as a rectangle for features not localized on a specific strand
as a bar plot for numeric features such as GC content and GC skew
In the example below, from the outside:
the first track displays the GC content
the second track displays one type of features (the CDS),
the third track displays several types of features corresponding to various types of RNA
etc.
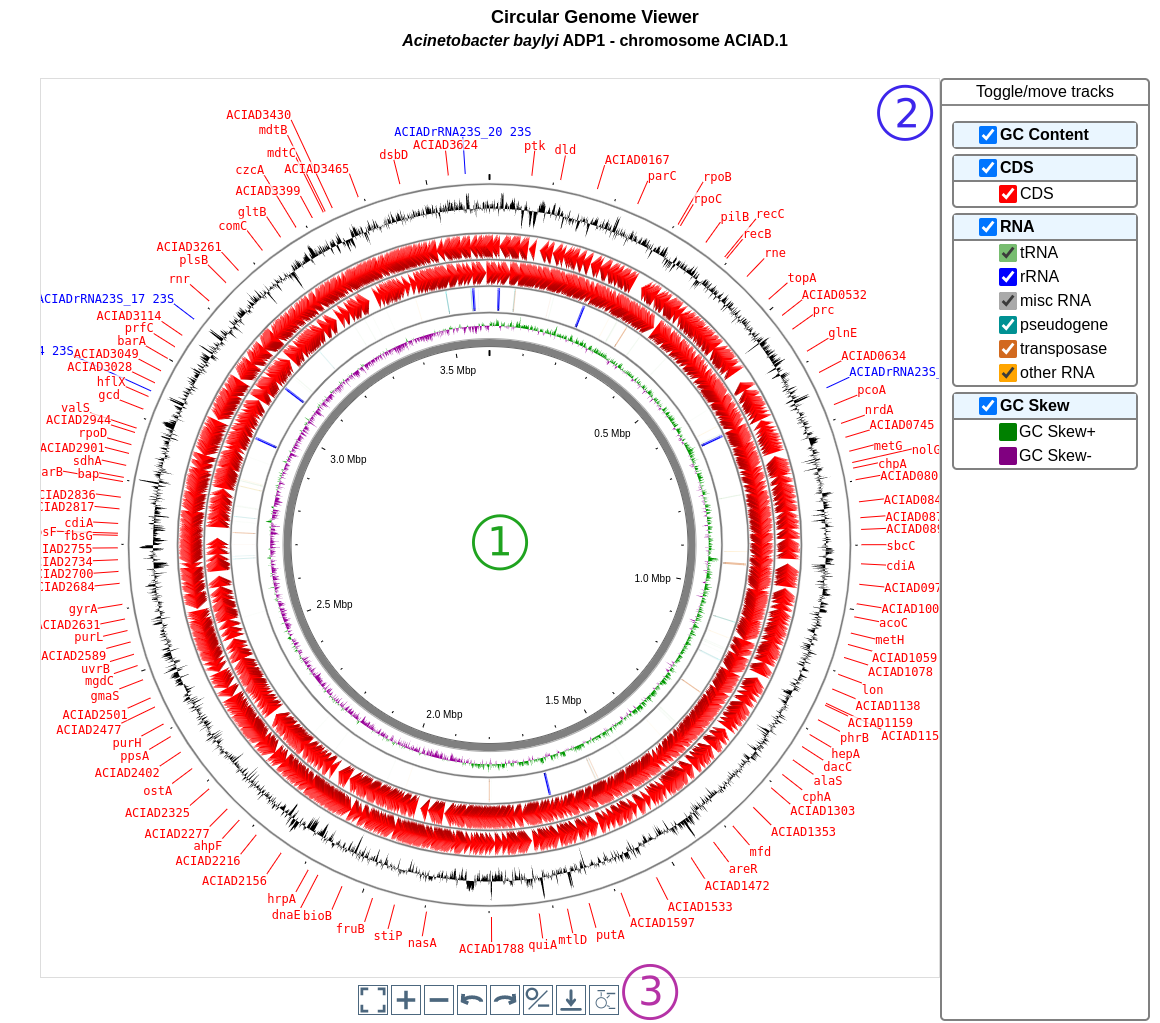
The tracks, their features and the color coding are chosen on each page to display the relevant informations but the user interface presented here is the same.
The user interface is made of 3 parts:
The viewer itself. You can zoom in and out and move along the sequence directly. You can hover a feature to get more details about it. The feature may be linked to other pages (indicated by the text Click for more details). The innermost track contains the sequence.
The panel on the right allows to control the appearance of the graph. Each track is represented by a box (in bold font) and each type of features in a track is represented by a checkbox. You can toggle the visibility of the whole track or of individual type by clicking on it. You can also drag & drop the tracks to change their order on the viewer.
The panel under the viewer shows buttons with neat functionalities. From left to right, you can :
recenter the view
zoom in
zoom out
move to the left
move to the right
switch between linear and circular view
download an image of the viewer (as a PNG)
toggle label visibility
What is Morpheus ?
Morpheus is a versatile matrix visualization and analysis software inside your web browser. Morpheus allows to visualize a dataset as a heat map and explore it with interactive tools. This allows to cluster, create new annotations, search, filter, sort, display charts, and more.
More: https://software.broadinstitute.org/morpheus/documentation.html
Morpheus is integrated in several tools in MicroScope.
Tip
Morpheus replaces MeV (Multiple Experiment Viewer) which was unsupported and based on obsolete technology.
Warning
The Morpheus window gives you access to the whole Morpheus application. This means that you have access to all the features of Morpheus including loading local data not related to MicroScope. Be careful when using it to avoid confusion.
Also note that some clustering metrics seems to not produce results. In this case, try using a different metric.
What is JalView ?
Jalview is a free, open source program developed for the interactive editing, analysis and visualization of multiple sequence alignments. It can also work with sequence annotation, secondary structure information, phylogenetic trees and 3D molecular structures.
More: http://www.jalview.org/
Tip
JalView is based on the Java Web Start technology. See how to use Java Web Start.
What is IGV ?
The Integrative Genomics Viewer (IGV) is a high-performance, easy-to-use, interactive tool for the visual exploration of genomic data. It supports flexible integration of all the common types of genomic data and metadata, investigator-generated or publicly available, loaded from local or cloud sources.
It is mainly used in RNASeq and variant analysis (see for instance RNA-Seq homepage, Read Count and DESeq Analysis) to allow the visualization of the coverage of the reference genome by the reads and to qualitatively compare coverage for various samples (experimental conditions or clones).
More: https://software.broadinstitute.org/software/igv/
Tip
IGV is based on the Java Web Start technology. See how to use Java Web Start.
After clicking the “Launch IGV” button the first window appears with a lower part already displaying the annotations of the reference genome (see below).
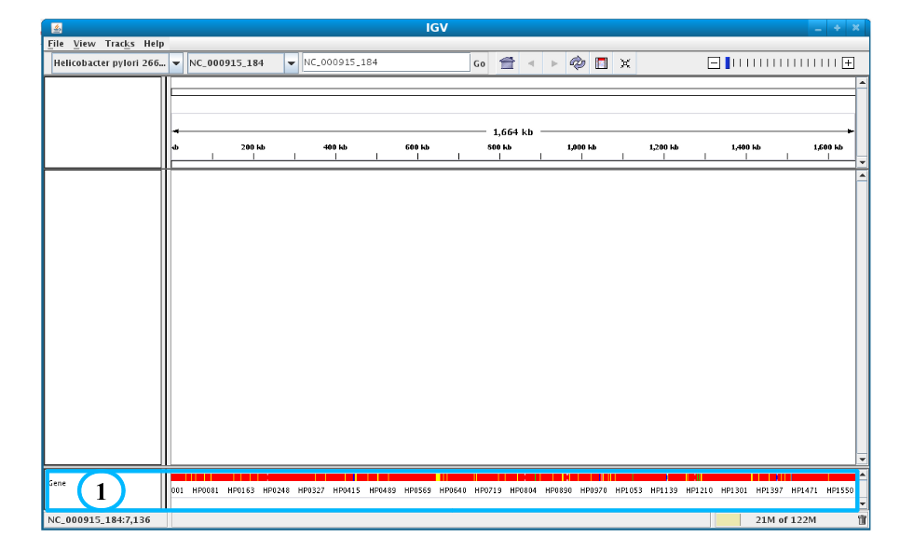
Section #1 contains genome annotations. Colors corresponding to a specific genomic object are:
red : CDS
yellow : fCDS
green : tRNA
blue : rRNA, miscRNA
To see genome coverage, users can load data in the drop down menu “File/Load from Server”. A list of available datasets for import will then appear in a new window. Tick the checkbox corresponding to the experiments to load in the browser and click “OK”.
Note
Warning: The loading process may take a while, so please be patient!
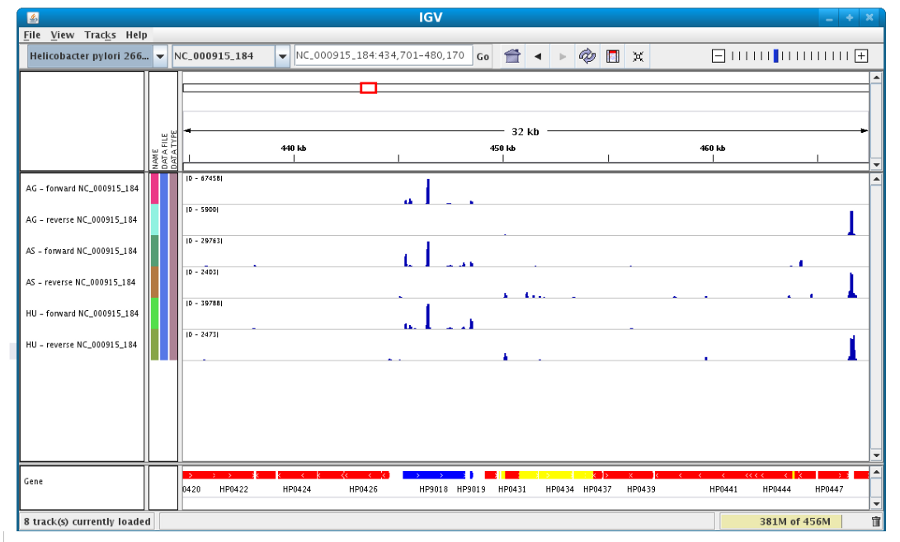
Then, the coverage is visible :

Users can also organize the display : Example : to compare the same type of experiment user can group forward and reverse experiment. (just click and drag)
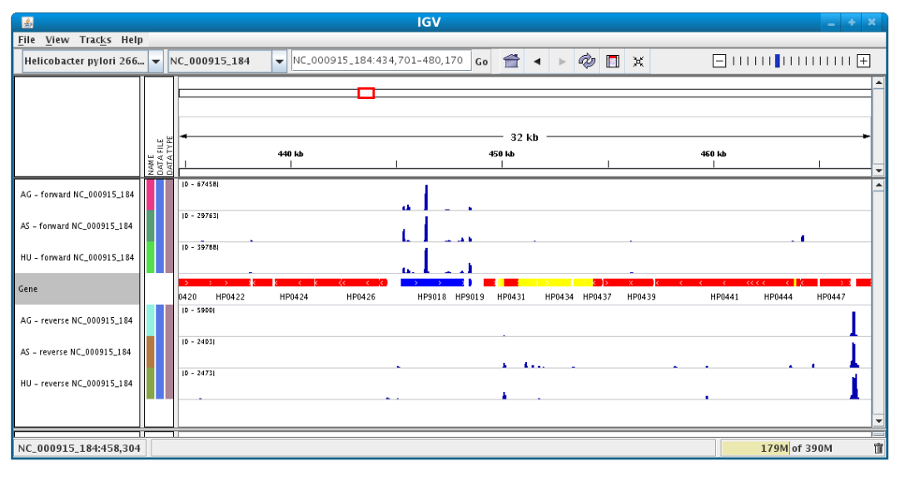
Users can enlarge the view by drag’n dropping the mouse on the area of interest.
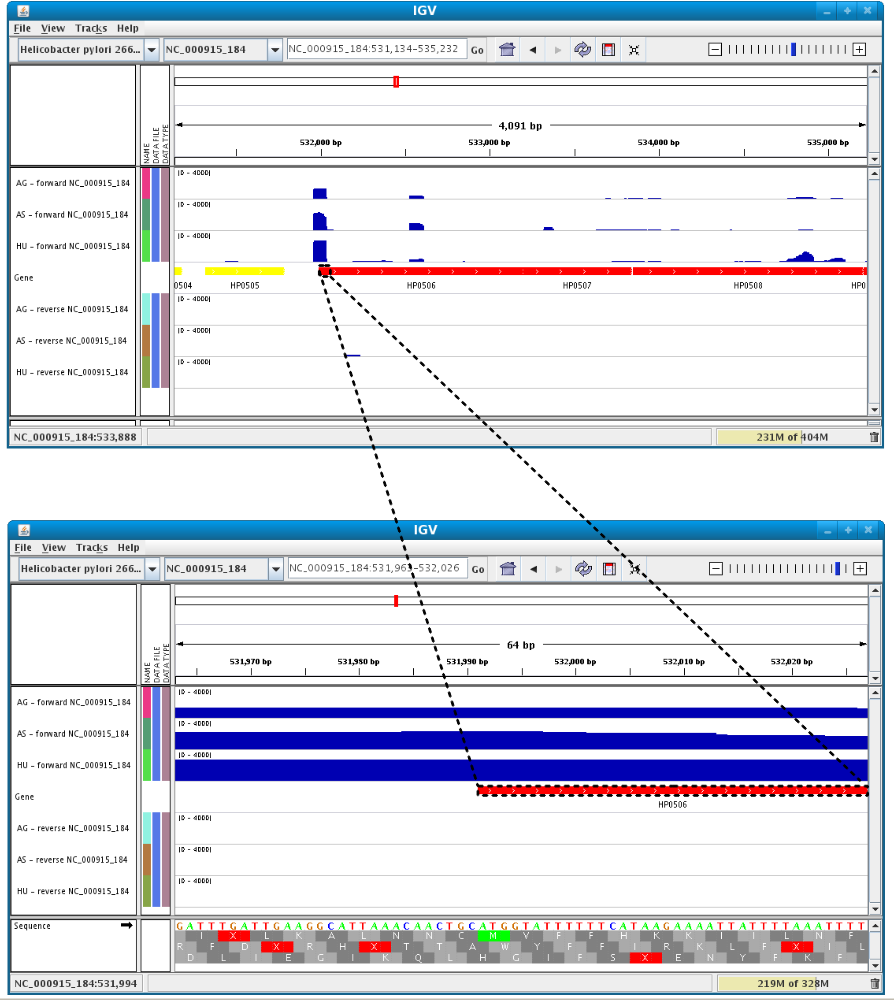
It is possible to zoom in to see gene sequence and translation.